ORIGINAL RESEARCH | https://doi.org/10.5005/jp-journals-10015-1724 |
Assessment of Facial Soft Tissue Thickness in Individuals having Skeletal Class II Malocclusion
1–3Department of Orthodontics and Dentofacial Orthopedics, NITTE (Deemed to be University), Mangaluru, Karnataka, India
Corresponding Author: Ravi M Subrahmanya, Department of Orthodontics and Dentofacial Orthopedics, NITTE (Deemed to be University), Mangaluru, Karnataka, India, Phone: +91 9845221386, e-mail: drmsravi@gmail.com
How to cite this article Kunnath JT, Subrahmanya RM, Dhillon H. Assessment of Facial Soft Tissue Thickness in Individuals having Skeletal Class II Malocclusion. World J Dent 2020;11(3):179–184.
Source of support: Nil
Conflict of interest: None
ABSTRACT
Aim: To measure and compare the facial soft tissue thicknesses (FSTT) between skeletal class I and class II patients.
Materials and methods: The sample consisted of lateral cephalograms of 120 patients (60 females and 60 males) of 18–30 years. These were subdivided into groups I, II, and III (n = 40 each) consisting of individuals with skeletal class I, mandibular retrognathism-induced skeletal class II, and maxillary prognathism-induced skeletal class II, respectively. Selected digital cephalograms were imported into the Nemoceph software (Nemotec, Spain) and calibrated. The thickness of the facial soft tissue was assessed and compared at 10 anthropological landmarks.
Result: Significant differences between the study groups were noted with respect to the mean Gls-G, Sn-A, and St-U1 values. In addition, sexual dimorphism was also noted.
Conclusion: Given the significant variation in the FSTT among the study groups, it is vital that the clinician in addition to accounting for the skeletal malocclusion also considers the soft tissue dimensions while formulating the treatment protocol.
Clinical significance: The differences among different skeletal malocclusions may be taken into account in patients undergoing orthodontics or corrective jaw surgery, both during diagnosis and treatment planning.
Keywords: Cephalometrics, Facial profile, Skeletal malocclusions, Soft tissue thickness.
INTRODUCTION
The human face is the most characteristic and discernible part of the human body. We express a range of human emotions with our faces. Attractiveness is judged according to the appearance of the face. To a large extent, social acceptance often depends on facial appearance. Beauty and health are ascribed to an attractive face, combined with feelings of social accomplishment, intelligence, and happiness. The face is of crucial significance for interpersonal communication and social contact, and our first memory of a person is related to the image of their face.1
A proportionate relationship between the different structures of a face is the key to its esthetic and pleasing appearance.2
Several factors are responsible for determining the facial profile of an individual including the facial soft tissue thickness (FSTT) and the dental and skeletal characteristics.3 Face contours are traditionally considered to be a result of the position of dental and skeletal tissue followed by the soft tissue. Over time, there has slowly but inexorably been a paradigm shift from the conventional analysis of the hard tissues of yore, to include soft tissues.4 Muscles, subcutaneous fat, soft tissue, and skin can develop proportionately and disproportionately corresponding to underlying skeletal structures. There can be variations in the thickness, length, and tone of the soft tissue, all of which affect the entire facial esthetic.5
Improvement in facial appearance has long been recognized as the most important motive for patients to accept orthodontic treatment. An indispensable element for understanding facial esthetics is an appreciation of the relationship between the facial bones and the soft tissue. It was previously thought that the configuration of the soft tissue profile was primarily related to the basic skeletal configuration. However, there have been reports to indicate that the soft tissue acts independently of the basic dentoskeletal base, since the soft tissue is very variable in thickness, and is considered to be the main factor in determining a patient’s final facial profile.6
The cephalometric analysis of hard and soft tissues is necessary for successful orthodontic or orthognathic surgical treatment for patients. This is used for determining the diagnosis and planning of orthodontic or orthognathic surgical treatment.7
The major treatment outcome expected through orthodontic/orthognathic treatment for any dentofacial deformity would be the restoration of the functionality and the facial characteristics.8 A harmonious soft tissue profile can often be challenging owing to the variability in tissue tension and thickness.
The position and relationships of facial structures are influenced by differences in the characteristics of the overlying soft tissues including its length, thickness, and tone. These variations between the soft and skeletal tissues often lead to disassociation between the facia l appearance and the underlying bony structures. These variations in turn can change the treatment strategy into a wide range of cosmetic and orthognathic surgeries. Particularly during orthognathic surgery, a clinician must be cognizant of the influence the soft tissue movement has on its underlying skeletal base, as the final treatment outcome largely depends on the final form and position of these soft tissues. Factors such as age and body mass can also cause variation in soft tissue thickness. Thicker soft tissues are relatively less sensitive to their underlying skeletal movements compared to thinner tissues.9
At present, there is a lack of literature exploring the influence of the soft tissue characteristics in determining the therapeutic strategy.
Therefore, this study was planned and designed to measure FSTTs of adult individuals with skeletal class II malocclusion and to compare them with that of individuals having skeletal class I relationships. The data from the present study could aid the clinician in strategizing the appropriate treatment protocol for enabling optimal facial reconstruction.
MATERIALS AND METHODS
A total of 120 adult individuals (60 males and 60 females) in the age group of 18–30 years with the class I or class II skeletal pattern were selected for the study from patients who had reported for treatment at the Department of Orthodontics and Dentofacial Orthopedics, A B Shetty Memorial Institute of Dental Sciences, Mangaluru.
The study population consisted of individuals from South Indian states of Kerala and Karnataka. Individuals with craniofacial syndromes, facial scars, facial asymmetry, and with a major illness were not considered. Individuals who have undergone orthognathic surgery/orthodontic therapy were also excluded from the study. A written informed consent was obtained from the selected individuals and after obtaining the clearance from the Institutional Ethics Committee, digital lateral cephalograms of the selected individuals were made using PlanmecaPromax (Planmeca Oy, Finland). The image receptor in PlanmecaPromax is in the form of a charge-coupled sensor chip. 68 kVp, 5 mA, and 18.7 seconds were standardized as the exposure parameters for the digital cephalograms.
These lateral cephalograms were divided into three groups of 40 each based on their malocclusion:
Group I: Skeletal class I malocclusion
Group II: Skeletal class II malocclusion due to mandibular retrognathism
Group III: Skeletal class II malocclusion due to maxillary prognathism (Fig. 1)
The lateral cephalograms of each individual were imported into the Nemoceph software (Nemotec, Spain) and calibrated before measurements were made. A total of 10 select landmarks were used to measure the FSTT (Fig. 2; landmarks plotted and 10 FSTT measurements marked on a calibrated lateral cephalogram).
- Gls-Gs: Linear distance from the most prominent point on the frontal bone to the soft tissue prominence on the forehead
- Ns-N: Distance from the point nasion to the soft tissue nasion
- Rh: Perpendicular distance from the intersection of the nasal bone and cartilage to the soft tissue
- Sn-A: Distance between subnasale and A point
- Ls-Pr: Distance between the most prominent point of the upper lip and prosthion
- St-U1: Distance between the most prominent point of the upper incisor and stomion
- Li-Id: Distance between the most prominent point of the lower lip and infradentale
- B-Lm: Distance from point B to labiomental sulcus
- Pogs-pog: The distance between bony pogonion and soft tissue pogonion
- Mes-me: The distance between bony menton and soft tissue menton
The data collected were entered in the Microsoft Excel worksheet and analyzed using IBM SPSS version 22. Descriptive statistics of quantitative variables were documented by using mean, standard deviation, and confidence intervals.
Descriptive statistics’ categorical variables were presented using frequency/percentages. Comparison of soft tissue thickness for each of the landmarks between different skeletal classes was made by using ANOVA.
A comparison between the mean of two quantitative variables was carried out through the Tukey’s range test, Student’s t test, and the Mann–Whitney U test. p values %3C; 0.05 were considered statistically significant.
RESULTS
On comparing the mean Gls-G values among the three groups, the differences were found to be significant. The mean GLs-G in group I was 4.97 mm and that of group II was 4.728 mm and the maximum mean value was found in group III. By applying ANOVA with the Fisher’s test, the difference was found to be significant (p = 0.032) (Table 1 and Fig. 3).
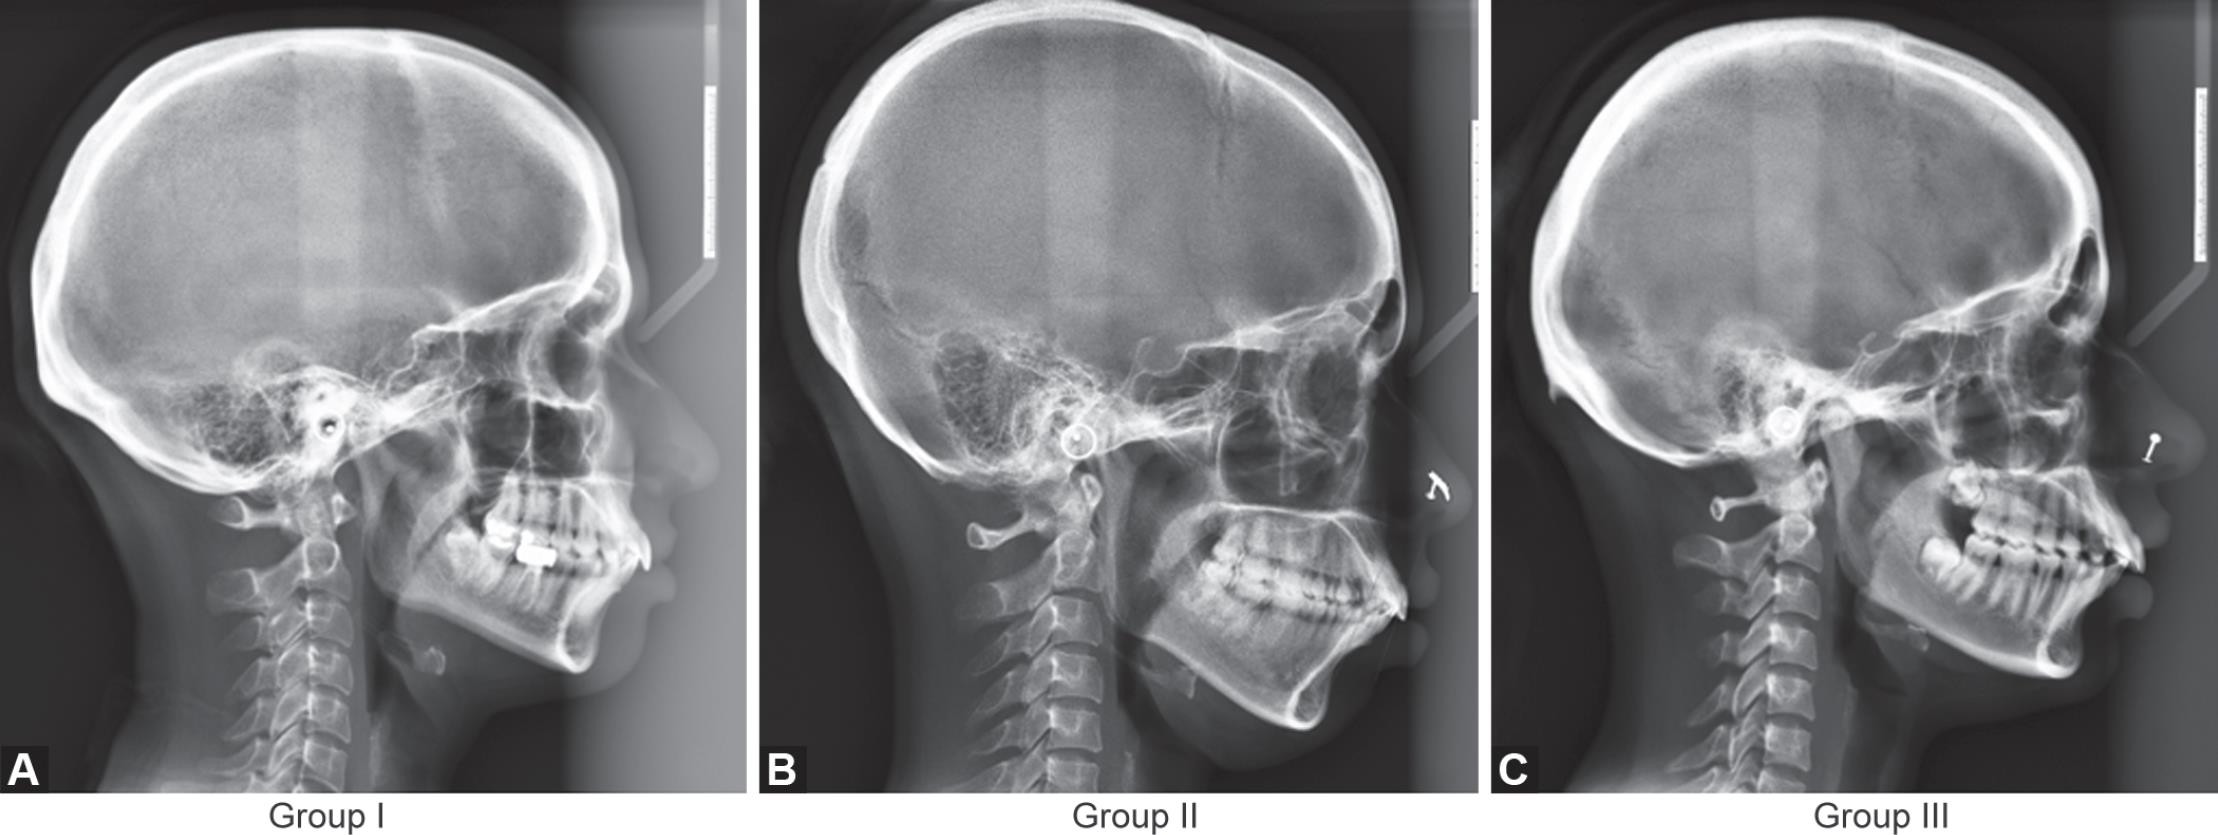
Figs 1A to C: Lateral cephalograms representing three groups
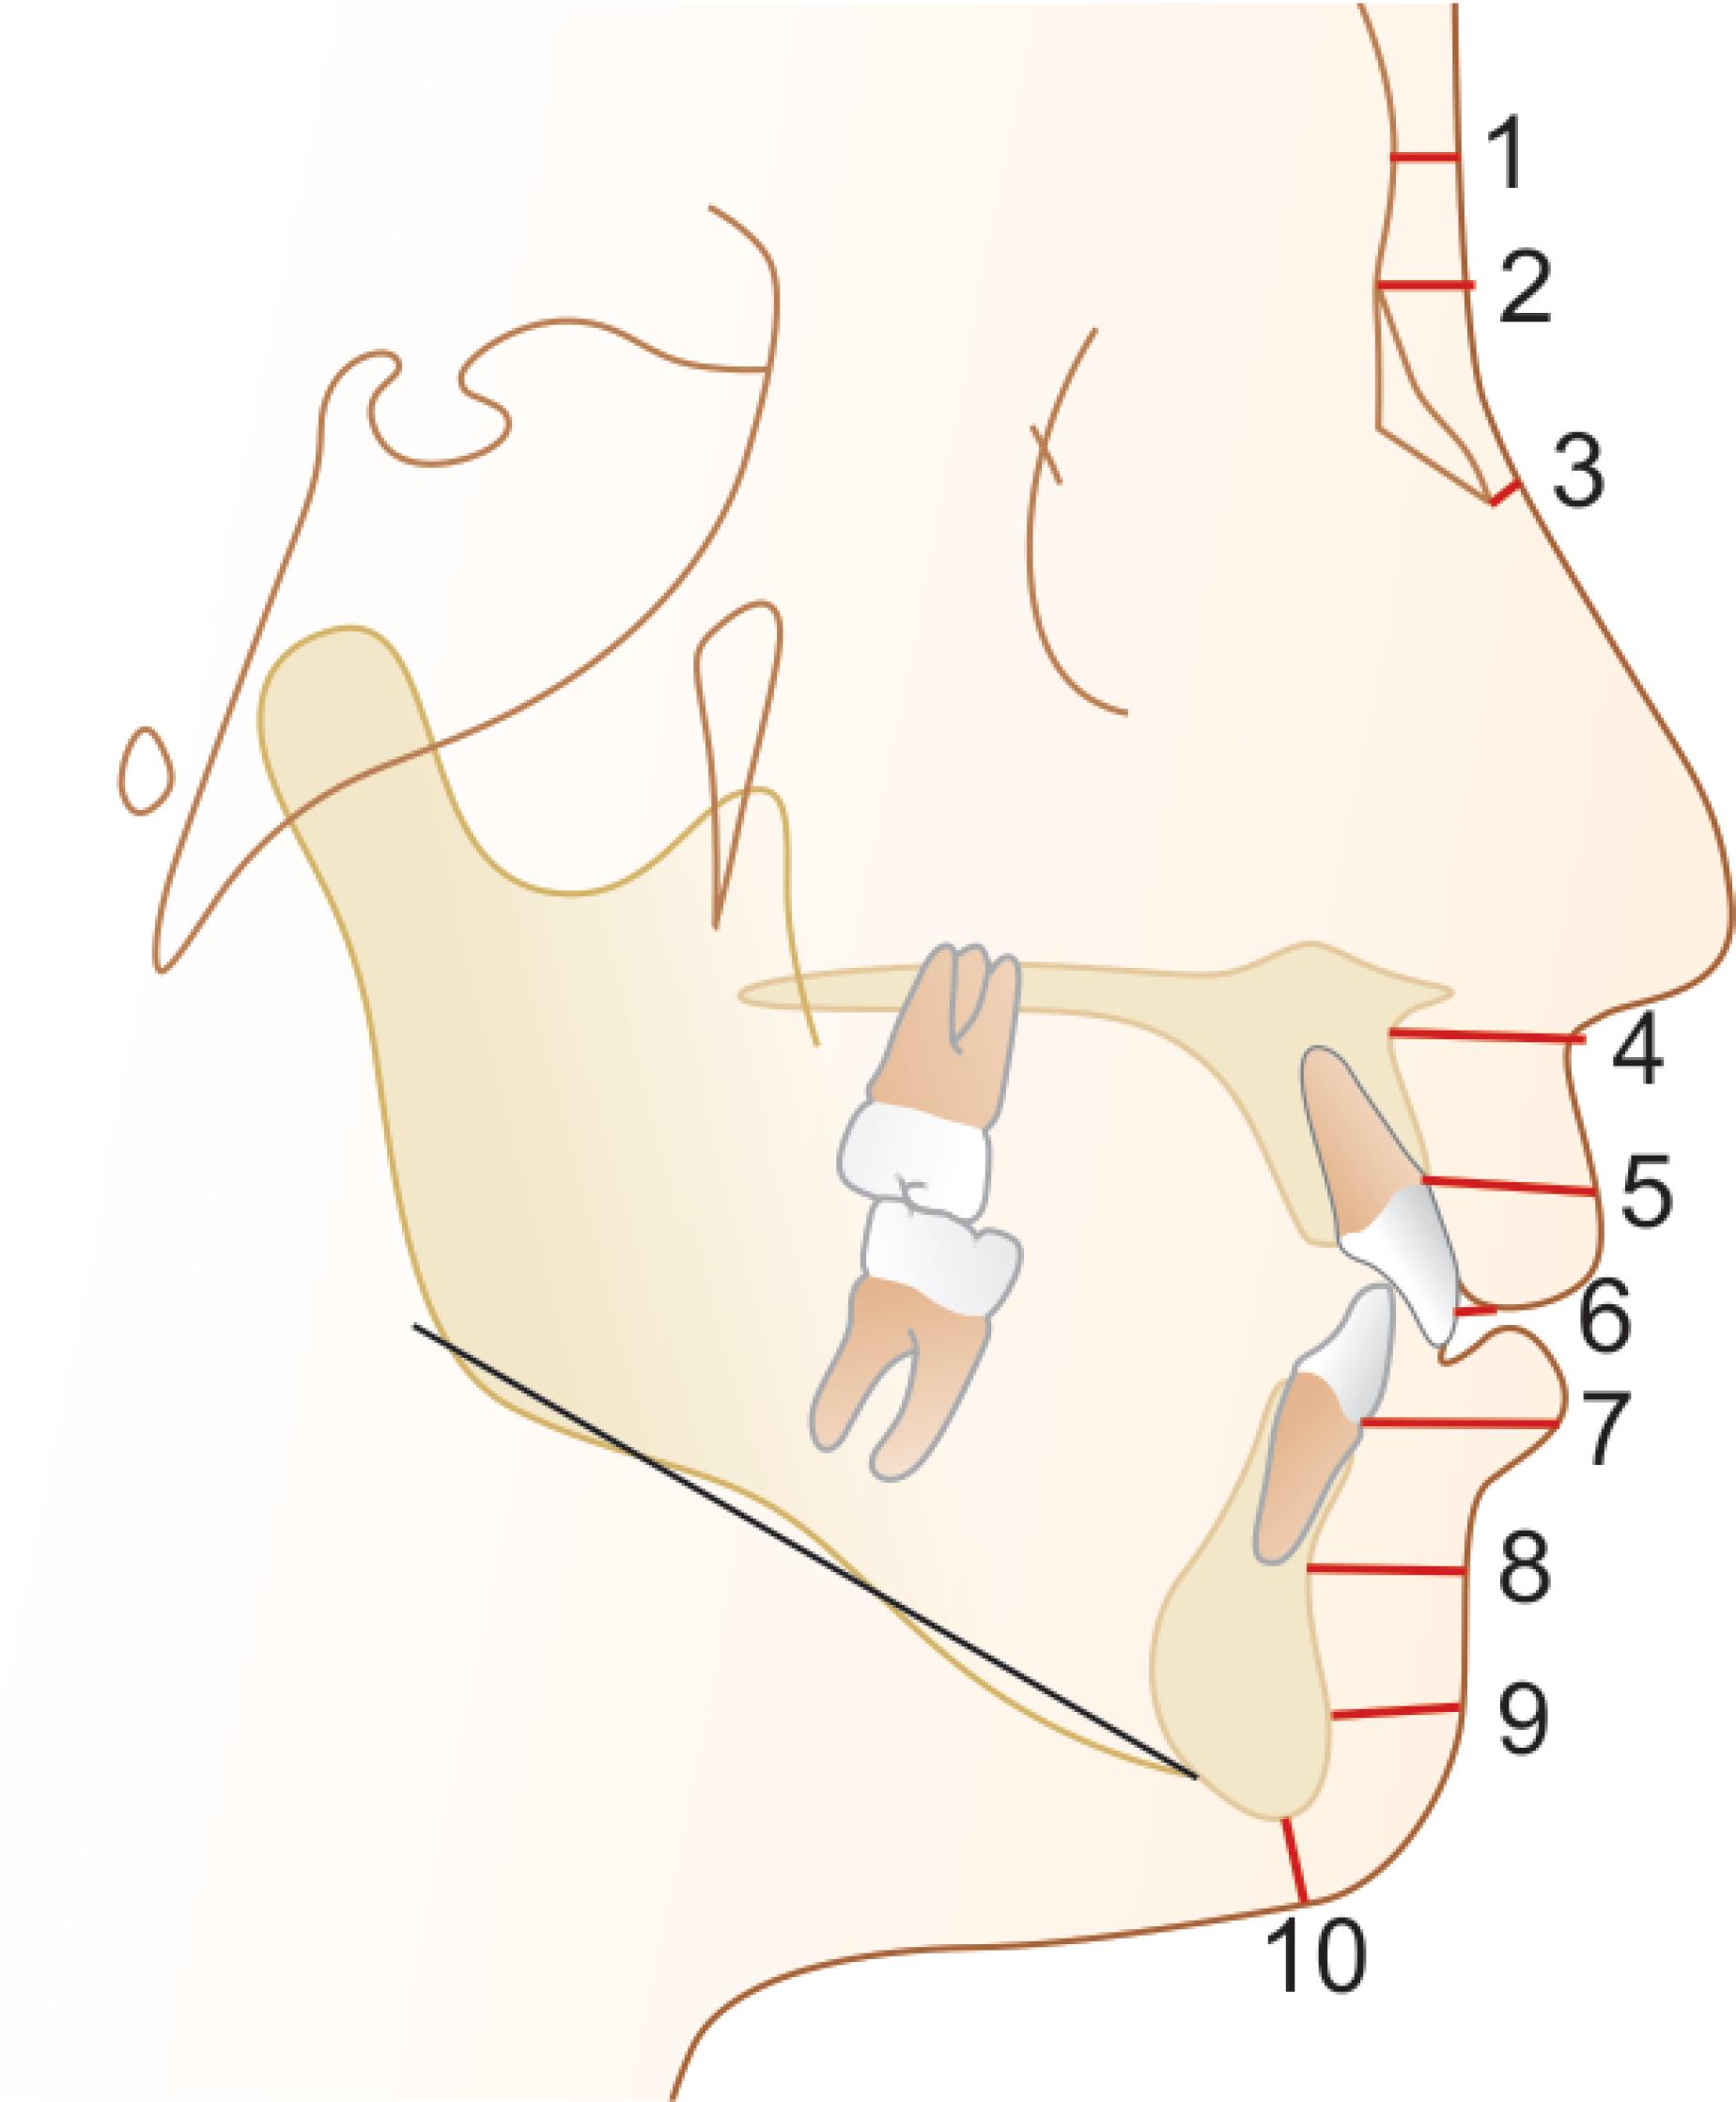
Fig. 2: The FSTT measurements marked on a calibrated lateral cephalogram
The maximum mean value for Sn-A was found in group II. By applying ANOVA with the Fisher’s test, the difference was found to be significant (p = 0.029) between the groups (Fig. 4).
While comparing mean St-U1 among the three groups, a significant difference (p < 0.001) was observed. However, on comparing the mean Ns-N, Rh-p, Ls-Pr, Li-ld, B-Lm, Pogs-Pog, and Mes-Me values among the three groups, there was no significant difference among the groups.
Gender Differences
Among males, the mean value for Sn-A of group I was 15.957 mm and for group II, 15.253 mm. The mean value in group III was 14.75 mm. Here the differences among the three groups was not significant (p = 0.124). But in the case of females, the difference in the mean score of Sn-A was found to be significant (p = 0.02). The mean score is minimum in the case of group III and maximum in the case of group II (Fig. 5).
Intercomparison between the groups was done separately for males and females. It was found that in males there was no significant difference between the groups. But in females, the mean difference of 1.704 was seen between group II and group III, which was statistically significant (p = 0.015).
| Variable | Group | n | Mean (mm) | Std. deviation | F | p |
|---|---|---|---|---|---|---|
| Gls-G | I | 40 | 4.970 | 0.687 | ||
| II | 40 | 4.728 | 0.606 | |||
| III | 40 | 5.115 | 0.670 | 3.553 | 0.032* | |
| Ns-N | I | 40 | 5.822 | 1.126 | ||
| II | 40 | 5.712 | 1.143 | |||
| III | 40 | 5.772 | 1.349 | 0.084 | 0.920 | |
| Rh-p | I | 40 | 2.439 | 0.373 | ||
| II | 40 | 2.296 | 0.301 | |||
| III | 40 | 2.267 | 0.340 | 2.944 | 0.057 | |
| Sn-A | I | 40 | 14.707 | 2.307 | ||
| II | 40 | 14.716 | 1.957 | |||
| III | 40 | 13.614 | 2.025 | 3.635 | 0.029* | |
| Ls-Pr | I | 40 | 12.945 | 1.539 | ||
| II | 40 | 13.082 | 1.700 | |||
| III | 40 | 12.908 | 1.795 | 0.119 | 0.888 | |
| St-U1 | I | 40 | 4.042 | 1.248 | ||
| II | 40 | 2.862 | 0.694 | |||
| III | 40 | 2.220 | 0.488 | 45.049 | <0.001* | |
| Li-Id | I | 40 | 15.287 | 1.841 | ||
| II | 40 | 16.002 | 1.954 | |||
| III | 40 | 15.498 | 1.891 | 1.500 | 0.227 | |
| B-Lm | I | 40 | 11.391 | 1.494 | ||
| II | 40 | 11.761 | 1.608 | |||
| III | 40 | 11.653 | 1.796 | 0.541 | 0.583 | |
| Pogs-Pog | I | 40 | 11.060 | 1.589 | ||
| II | 40 | 11.047 | 1.732 | |||
| III | 40 | 10.890 | 1.635 | 0.131 | 0.877 | |
| Mes-Me | I | 40 | 6.377 | 1.476 | ||
| II | 40 | 6.090 | 1.345 | |||
| III | 40 | 5.966 | 1.435 | 0.879 | 0.418 |
* p < 0.05 significant, p %3E; 0.05 nonsignificant, and p < 0.001 highly significant

Fig. 3: Comparison of mean Gls-G among the three groups

Fig. 4: Comparison of mean Sn-A among the groups

Fig. 5: Comparison of mean Sn-A among the groups in males and females
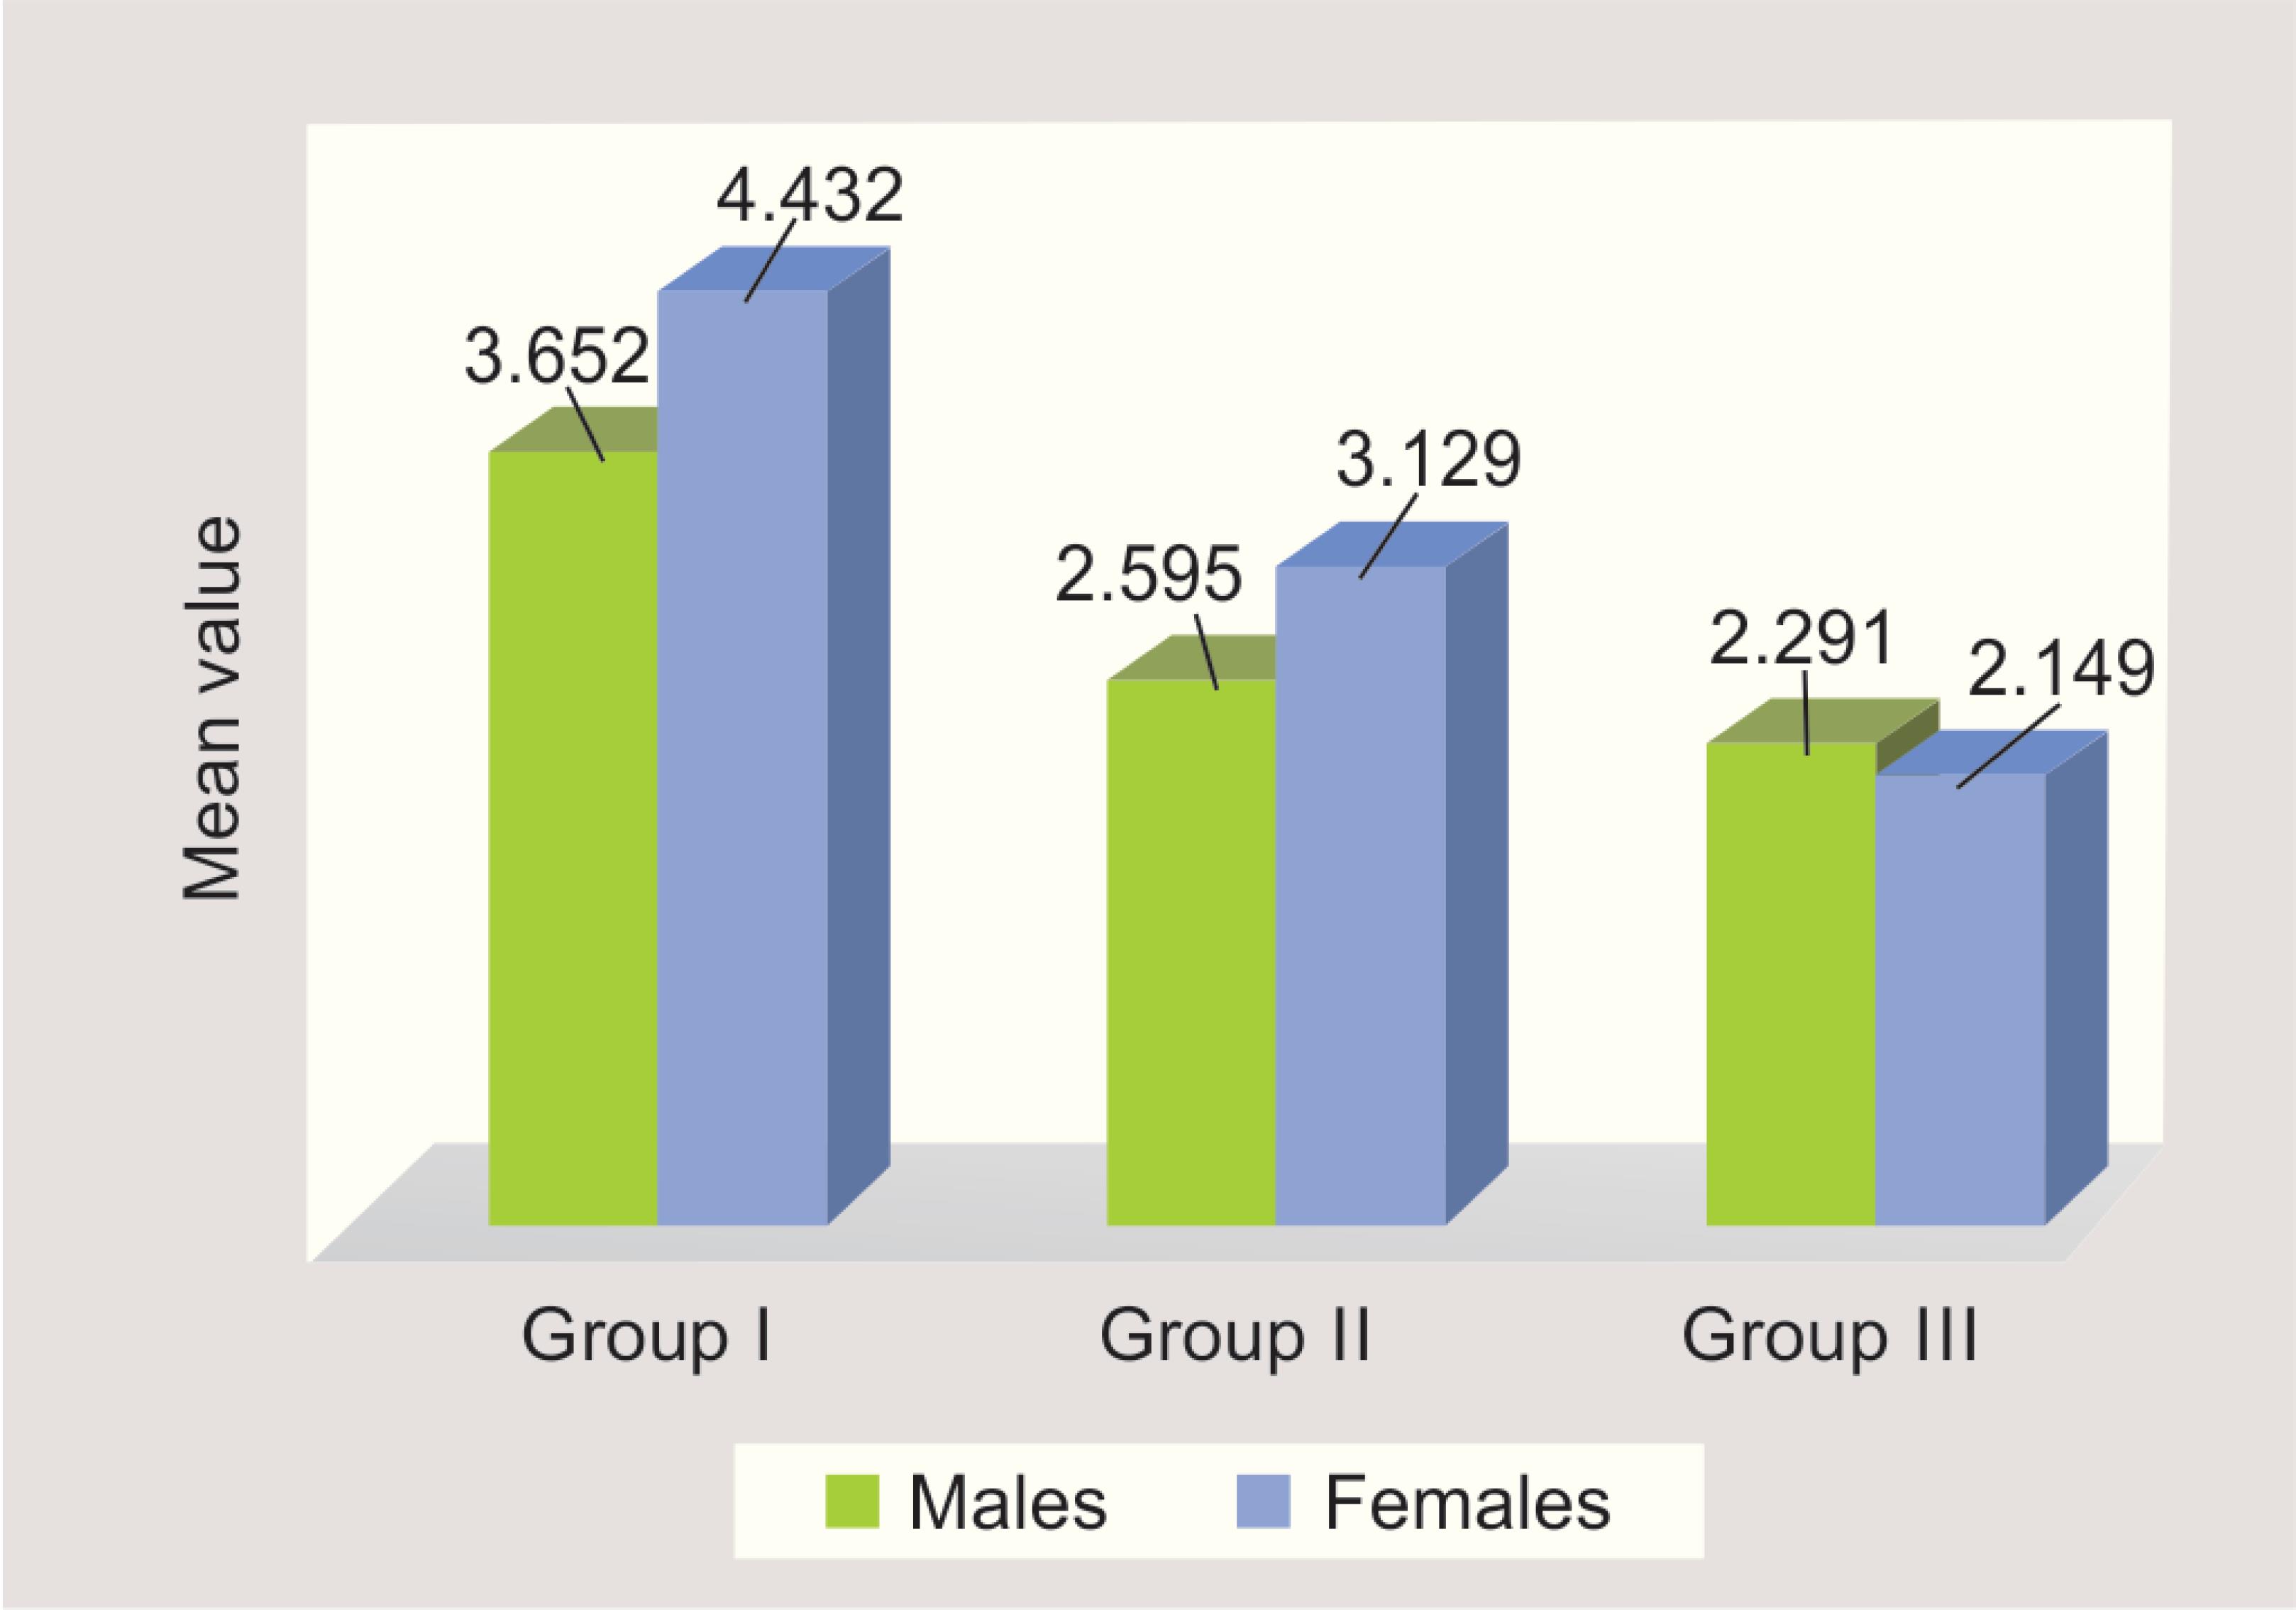
Fig. 6: Comparison of mean St-U1 among the groups in males and females
The difference in the mean value for St-U1 in males was significant (p < 0.001) between the three groups.
In females, the mean scores of St-U1 in the different groups were found to be statistically significant (p < 0.001). The intercomparison between the groups was also significant in males as well as females. In females, the comparison between the groups was found to be very highly significant (p < 0.001) (Fig. 6).
The mean values of Gls-G, Ns-N, Rh-P, Ls-Pr, Li-Ld, B-Lm, Pogs-Pog, and Mes-Me were compared among the three groups in males and females separately. The ANOVA test showed that the differences among the groups are insignificant.
Ultimately, significant differences in soft tissue thickness among skeletal malocclusions were observed. These differences in soft tissue thickness among skeletal malocclusions were notable at the labralesuperius, stomion, and labrale inferius sites in both men and women.
These differences among the various malocclusions may be taken into account in patients undergoing orthodontics or corrective jaw surgery, both during diagnosis and treatment planning.
DISCUSSION
Craniofacial soft tissue thickness (CFSTT) studies have been carried out to create databases to act as quantitative guides in craniofacial identification and facial approximation. Studies similar to the present study have been conducted using various methods such as CBCT, MRI, CT, ultrasound,10 roentgenography using lateral cephalograms, and also needle depth measurements on cadavers.11 The lateral cephalometric analysis of soft tissues allows examination and measurement of soft tissue landmarks of the facial profile in vertical and horizontal dimensions.12 In this study, we have used lateral radiographs for measuring CFSTT at 10 distinct landmarks. This method was used so that subjects are scanned in an erect posture, which allowed an undistorted view of the facial soft tissues. One disadvantage of this method is the radiation exposure. The radiographs were taken at the beginning of orthodontic treatment for use as a diagnostic aid.
Different ethnic groups show a varying degree of soft tissue thickness at particular anthropological landmarks. Tissue thickness of one region cannot be applied to another population.13 Hence, it is important to compile a set of soft tissue depth for each population. The categorization of soft tissue depths in a South Indian population is complicated as they are often associated with ancestral filiations. It is a multiethnic, multicultural, and polygenic part of the country, with people having a predominantly mixed racial origin.
Therefore, the construction of a database on soft tissue thickness of a particular population is required. This will help in obtaining an accurate facial reconstruction.
Soft tissues do not form a layer of equal thickness, which simply shapes the configuration of basic dental and skeletal structures. The facial profile reflects the variability of soft tissue thickness and should be a factor in the diagnosis and the planning of orthodontic treatment.14
The orthognathic surgery is mostly undertaken by patients in the second and third decades of life15,16 to improve facial esthetics and remedy malocclusions, which is reflected in the age group of the present study sample (18–30 years).
Several authors including Arnett and Gunson17 and Uysal18 have used the relaxed lip position while estimating the profile of the soft tissue as the relaxed position allows optimal soft to hard tissue correlation while avoiding any muscular compensation for the skeletal malocclusion. Thus, the present study employed the relaxed lip position during the cephalogram.
Although, the present study showed a gender-based difference in the soft issue thickness (greater thickness in men than women), a statistically significant difference was not seen in all the assessed points of each study group. A similar gender-based difference was noted by Uysal et al., who found significant differences at labrale inferius, labrale superius, pogonion, and menton. Similar gender-based differences were obtained by Basciftci et al.19 and Hamdan.20 Li-Id has the highest soft tissue depth in all the study groups. The lower lip is often pushed down and outwards if the maxillary anterior teeth is proclined and angulated, which potentially could influence the thickness at labrale inferius, labrale superius, and stomion.
Previous studies have reported that soft tissue thickness is not significantly affected by the occlusal pattern.21 The retraction of the mandible was shown to increase the tissue thickness at gnathion. Likewise, an increasing mandibular protrusion was shown to decrease the soft tissue thickness at pogonion. No significant difference in the soft tissue thickness at pogonion and menton was noted in the present study between the study groups. Likewise, there were no significant soft tissue depth difference at pogonion or labiomental sulcus between the study groups. The soft tissue thickness varied from glabella to rhinion in the present study. There was a progressive decrease in thickness with the greatest thickness noted at the bottom of the lip and the least thickness noted at rhinion. The thickness of the soft tissue increased toward the bottom of the lip from the subnasale. Thinning was noted toward the gnathion from the labiomental region. Overall, a thin-thick-thin characteristic was noted for the facial soft tissues. The gender-based difference in the soft tissue thickness of the present study is in agreement with that of Simpson and Hennenberg.22
In the maxillary region, a compensatory soft tissue build-up was noted for groups II and III, while group I had a relatively thinner depth of the soft tissue, which is in accordance to Wang et al.23
Utsuno et al. evaluation of the soft tissue thickness among skeletal classes in Japanese women revealed significant soft tissue thickness in the mental and upper lip region.
A significant soft tissue thickness was noted in the upper lip zone (Ls-Pr, St-U1 points) in females. A relatively thinner soft tissue was noted at St-U1 points in skeletal class II. At the Gls-G point, a significant difference in the soft tissue thickness was noted between all the three study groups, with group III showing the greatest thickness.
The upper face region (Gls-Gl, Ns-N, and Rh) did not show any significant differences among the study groups in the Utsuno et al. study, suggesting that there is no variation in the soft tissue depth when it is tightly adherent to the bone.24 Increased body mass can influence the thickness and depth of soft tissues. Thus, the lack of consideration of the body mass index (BMI) is a major limitation in the present study.
CONCLUSION
Soft tissue thickness varied significantly among the study groups. Notable differences were seen at labrale inferius, labrale superius, and stomion and in both males and females. Sexual dimorphism was noted. Men had a greater soft tissue thickness than women in all sites. Soft tissue differences must be considered as a major criteria while formulating orthodontic/orthognathic treatment strategies. The results of the present study reinforce evidence of a sophisticated and strong relationship between soft tissue thickness of the face, skeletal pattern, gender, and facial pattern.
REFERENCES
1. Fink B, Neave N. The biology of facial beauty. Int J Cosmet Sci 2005;27(6):317–325. DOI: 10.1111/j.1467-2494.2005.00286.x.
2. Sforza C, de Menezes M, Ferrario VF. Soft-and hard-tissue facial anthropometry in three dimensions: what’s new. J Anthropl Sci 2013;91:159–184.
3. Jeelani W, Fida M, Shaikh A. Facial soft tissue thickness among various vertical facial patterns in adult Pakistani subjects. Forensic Sci Int 2015;257:517.e1–517.e6. DOI: 10.1016/j.forsciint.2015.09.006.
4. Hamid S, Abuaffan AH. Facial soft tissue thickness in a sample of Sudanese adults with different occlusions. Forensic Sci Int 2016;266:209–214. DOI: 10.1016/j.forsciint.2016.05.018.
5. Ramesh G, Nagarajappa R, Sreedhar G, et al. Facial soft tissue thickness in forensic facial reconstruction: is it enough if norms set? J Forensic Res 2015;6(5):1. DOI: 10.4172/2157-7145.1000299.
6. Somaiah S, Khan MU, Muddaiah S, et al. Comparison of soft tissue chin thickness in adult patients with various mandibular divergence patterns in Kodava population. Int J Orthod Rehabil 2017;8(2):51. DOI: 10.4103/ijor.ijor_38_16.
7. Wirthlin JO, Shetye PR. Orthodontist’s role in orthognathic surgery. Semin Plast Surg 2013;27(03):137–144.. Thieme Medical Publishers.
8. Kasai K. Soft tissue adaptability to hard tissues in facial profiles. Am J Orthod Dentofacial Orthop 1998;113(6):674–684. DOI: 10.1016/S0889-5406(98)70228-8.
9. Gill DS, Lloyd T, East C, et al. The facial soft tissue effects of orthognathic surgery. Facial Plast Surg 2017;33(5):519–525. DOI: 10.1055/s-0037-1606334.
10. Baillie LJ, Muirhead JC, Blyth P, et al. Position effect on facial soft tissue depths: a sonographic investigation. J Forensic Sci 2016;6 (Suppl 1):S60–S70. DOI: 10.1111/1556-4029.12935.
11. Lodha A, Mehta M, Patel MN, et al. Facial soft tissue thickness database of Gujarati population for forensic craniofacial reconstruction. Egyptian J Forensic Sci 2016;6(2):126–134.
12. Arnett GW, Jelic JS, Kim J, et al. Soft tissue cephalometric analysis: diagnosis and treatment planning of dentofacial deformity. Am J Orthod Dentofacial Orthop 1999;116(3):239–253. DOI: 10.1016/S0889-5406(99)70234-9.
13. Sahni D, Singh G, Jit I, et al. Facial soft tissue thickness in northwest Indian adults. Forensic Science Int 2008;176(2-3):137–146. DOI: 10.1016/j.forsciint.2007.07.012.
14. Subramaniam S, Karthi M, Senthil Kumar KP, et al. Comparison of soft tissue chin prominence in various mandibular divergence patterns of Tamil Nadu population. J Indian Acad Dent Spec Res 2016;3(2):39–42. DOI: 10.4103/jiadsr.jiadsr_3_17.
15. Peacock ZS, Lee CC, Klein KP, et al. Orthognathic surgery in patients over 40 years of age: indications and special considerations. J Oral Maxillofac Surg 2014;72(10):1995–2004. DOI: 10.1016/j.joms.2014.03.020.
16. Kamak H, Celikoglu M. Facial soft tissue thickness among skeletal malocclusions: is there a difference? Korean J Orthod 2012;42(1):23–31. DOI: 10.4041/kjod.2012.42.1.23.
17. Arnett GW, Gunson MJ. Facial planning for orthodontists and oral surgeons. J Orthod Dentofacial Orthop 2004;126(3):290–295. DOI: 10.1016/j.ajodo.2004.06.006.
18. Uysal T, Yagci A, Basciftci FA, et al. Standards of soft tissue Arnett analysis for surgical planning in Turkish adults. Eur J Orthodontics 2009;31(4):449–456. DOI: 10.1093/ejo/cjn123.
19. Basciftci FA, Uysal T, Buyukerkmen A. Determination of Holdaway soft tissue norms in Anatolian Turkish adults. Am J Orthod Dentofacial Orthop 2003;123(4):395–400. DOI: 10.1067/mod.2003.139.
20. Hamdan AM. Soft tissue morphology of Jordanian adolescents. Angle Orthod 2010;80(1):80–85. DOI: 10.2319/010809-17.1.
21. Dumont ER. Mid-facial tissue depths of white children: an aid in facial feature reconstruction. J Forensic Sci 1986;31(4):1463–1469. DOI: 10.1520/JFS11926J.
22. Simpson E, Henneberg M. Variation in soft tissue thicknesses on the human face and their relation to craniometric dimensions. Am J Phys Anthropol 2002;118(2):121–133. DOI: 10.1002/ajpa.10073.
23. Wang J, Zhao X, Mi C, et al. The study on facial soft tissue thickness using Han population in Xinjiang. Forensic Science Int 2016;266:585.e1–585.e5. DOI: 10.1016/j.forsciint.2016.04.032.
24. Utsuno H, Kageyama T, Uchida K, et al. Facial soft tissue thickness differences among three skeletal classes in Japanese population. Forensic Science Int 2014;236:175–180. DOI: 10.1016/j.forsciint.2013.12.040.
________________________
© The Author(s). 2020 Open Access This article is distributed under the terms of the Creative Commons Attribution 4.0 International License (https://creativecommons.org/licenses/by-nc/4.0/), which permits unrestricted use, distribution, and non-commercial reproduction in any medium, provided you give appropriate credit to the original author(s) and the source, provide a link to the Creative Commons license, and indicate if changes were made. The Creative Commons Public Domain Dedication waiver (http://creativecommons.org/publicdomain/zero/1.0/) applies to the data made available in this article, unless otherwise stated.